Glaciers of Washington
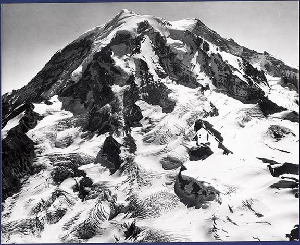
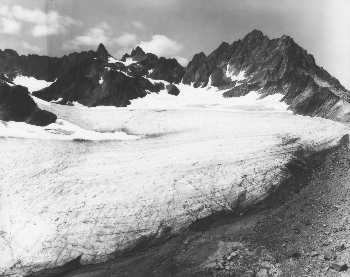
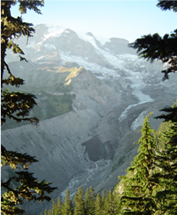
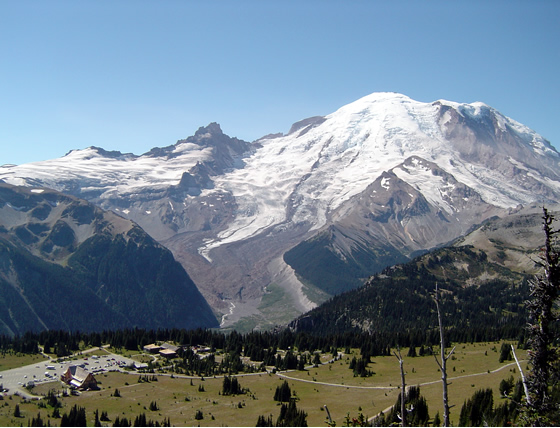 Emmons Glacier, Mount Rainier. (Mike Hekkers 2007) |
Welcome to the Glaciers of Washington web page. This page describes the history and glacial extent of Washington’s magnificent glaciers. Washington's varied landscapes were shaped by the force of glaciers. After Alaska, Washington is the second most glaciated state in the US. Glaciers are found on nearly all the high mountains in the state: the Olympic Mountains; the North Cascade and Stuart ranges; all the major volcanoes; and Goat Rocks. Several national parks (Olympic, North Cascades, and Mount Rainier) provide an opportunity to enjoy the beauty of these glaciers. During the last ice age (Pleistocene), an ice sheet nearly a mile thick covered much of Puget Sound, carving its north to south pattern of hills. In Eastern Washington, the erosional scabland features were formed during the same time when titanic floods burst from ice-dammed lakes.
Contents
Glacier Extent
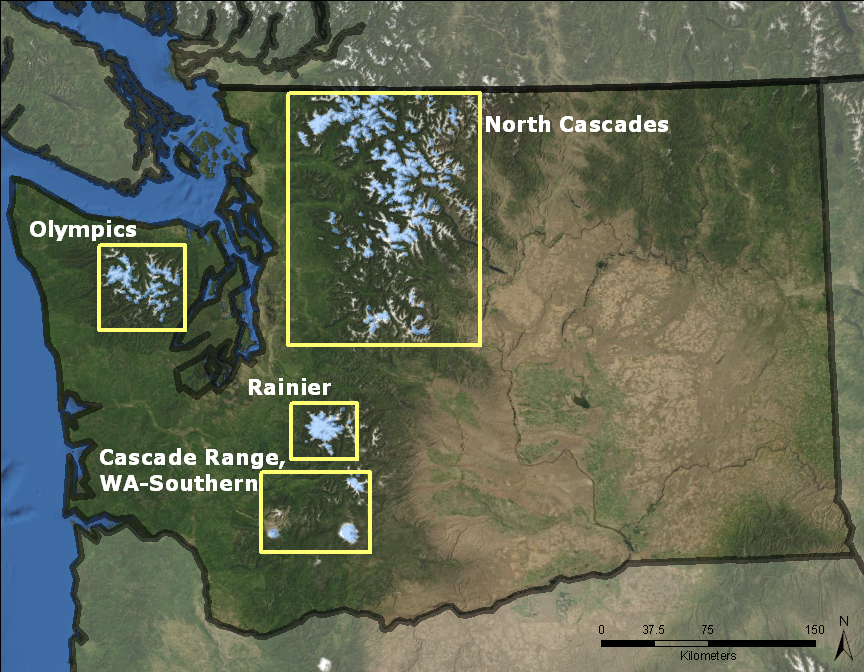 Blue Marble Imagery |
|
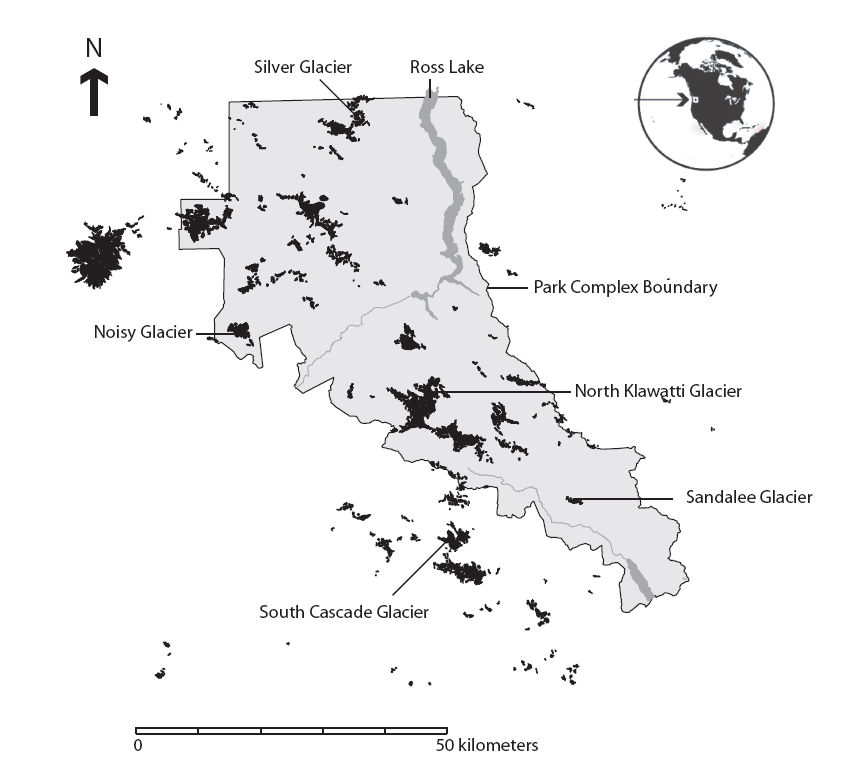
Washington is the second most glaciated state in the US, with 449 km2 of glaciers and perennial snow and ice features. (Second to Alaska’s 90,000 km2 of glaciers.) It is by far more ice-covered than the third most glaciated state of Wyoming, which has 74 km2. The major glaciated areas are the North Cascades (231 km2 ) and Mount Baker (49 km2); Mount Rainier (88 km2 for named glaciers only) (Nylen, 2004); and the Olympic Mountains (37km2). Other glaciated regions are in Washington's southern Cascades: Mount Adams with 24 km2, Goat Rocks with 5 km2, and Mount Saint Helens with 2 km2. Overall, there are approximately 3,095 perennial snow and ice features. Note: all statistics here are based on USGS 1:24,000 scale topographic quadrangle maps which are derived from mapping photography ranging from 1943 to 1987 (Fountain et al., 2007). In the North Cascades National Park, glacier area decreased by 7% from 1958 to 1998 (Granshaw and Fountain, 2006; Granshaw, 2002). Smaller glaciers lost significantly more area than larger glaciers. The well-studied South Cascade Glacier shrank by 22% during this time period (USGS), while the Blue Glacier in Olympic National Park saw a terminus retreat of 2% between 1957 and 1997 (Conway et al., 1999). The glaciers on Mount Rainier decreased in area by 21% between 1913 and 1994 (Nylen, 2004). |
History
Glacial History
|
During the Pleistocene, the maximum glacial extent 20,000 years ago, the Cordilleran Ice Sheet extended into the US from Canada. Two southern lobes on either side of the Cascade Range covered the Puget Lowlands and the Okanogan highlands. Canadian geologist George M. Dawson first proposed that this massive ice sheet flowed from northern British Columbia in 1891 (Denton and Hughes, 1981). Approximately 14,000-11,000 years ago the ice sheet retreated north of the U.S.-Canadian border (Waitt Jr. and Thorson, 1983). The Channeled Scablands in the eastern half of the state were catastrophically sculpted by the outburst floods from ice-dammed Glacial Lake Missoula. |
||
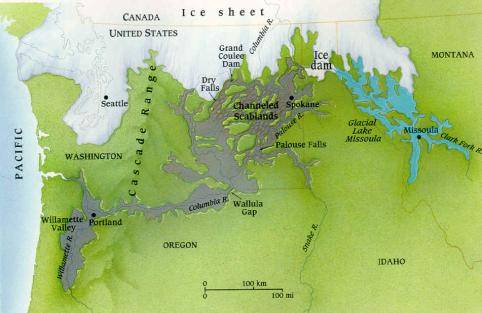 Areas directly affected by floodwaters from Glacial Lake Missoula. ©1995, 2003 Alan Kettler. All rights reserved. Used here by permission. Slightly revised from version that appeared in Smithsonian , April 1995, p. 50. |
||
Early Exploration
|
The first observations of the glaciated peaks in Washington were by Capt. Vancouver in the late 1700s, during his exploration of the northwest coast. Further discovery of this region did not occur until the Lewis and Clark expeditions (1804-1806), and mapping efforts were not initiated for another fifty years, by the initial Pacific Railroad survey between 1853 and 1855 (Beckey, 2003). The International Boundary Survey carried out the original boundary survey in the North Cascades region from 1858-1860 (Baker, 1900). Surveyor Henry Custer wrote of the Challenger Glacier on Whatcom Peak in the North Cascades, “a solid wall of pure ice, to a height of over 5000 feet or near the summit of a very high mountain.” He compared the glacier’s “matchless grandeur” with Niagara Falls, only ten times as high (Beckey, 2003). |
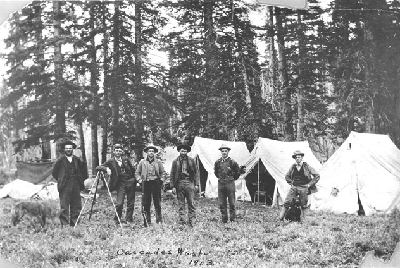 US Geological Survey (USGS) Field crew in the Cascade Mountains, Washington. 1903. (U.S. Geological Survey) |
||||||||
|
In 1857, Lt. August V. Kautz climbed Mount Rainier via what is now the Nisqually Glacier, but had to turn back from the summit because they were ill-prepared for the cold, windy conditions and impending nightfall. His party members suffered from many health problems including snow-blindness (Kautz, 1875). Eleven years later, Philemon Beecher Van Trump and Hazard Stevens were the first to reach the summit of Mount Rainier, but were forced to stay the night in the steam caves to rest and escape the icy winds (Beckey, 2003). |
|||||||||
|
|||||||||
North Cascades |
Mount Baker |
Stuart Range |
Olympic Mountains |
Mount Rainier |
Goat Rocks |
Mount Adams |
Mount Saint Helens |
North Cascades
|
||||
|
||||

Back to Glaciers in Washington
Back to Contents
Mount Baker
|
Mount Baker is a large stratovolcano, and at 3,285m is the tallest peak in the North Cascades Range (Harper, 1993). Mount Baker has 124 perennial snow/ice features, including 15 named glaciers. The total area of all features is 49 km2, of which the named glaciers cover 44 km2. |
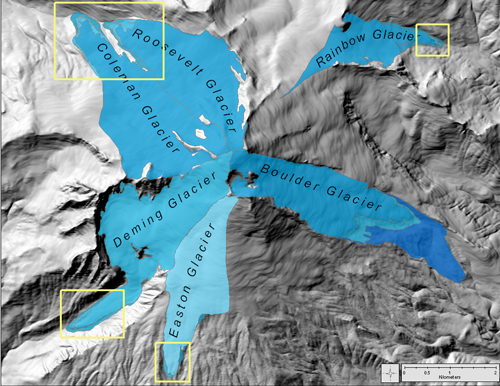
 Shaded relief map of Mount Baker. Click on the map above for the full size version. |
|
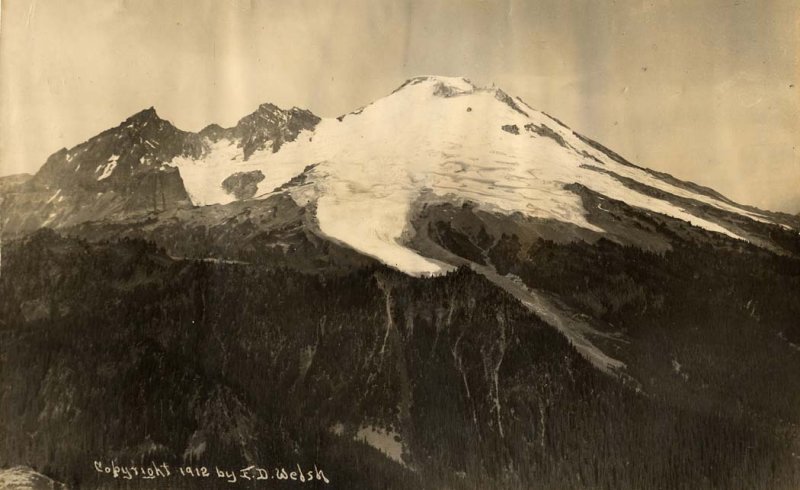 Easton Glacier 1912. |
||
Back to Glaciers in Washington
Back to Contents
Stuart Range
|
The Stuart Range has 82 perennial snow/ice features, including 7 named glaciers. The total ice-covered area is 9 km2, and the area of named features is 3 km2. Mount Stuart (2,870m) is the second highest non-volcanic peak in the Cascades (Tabor, 1982). |
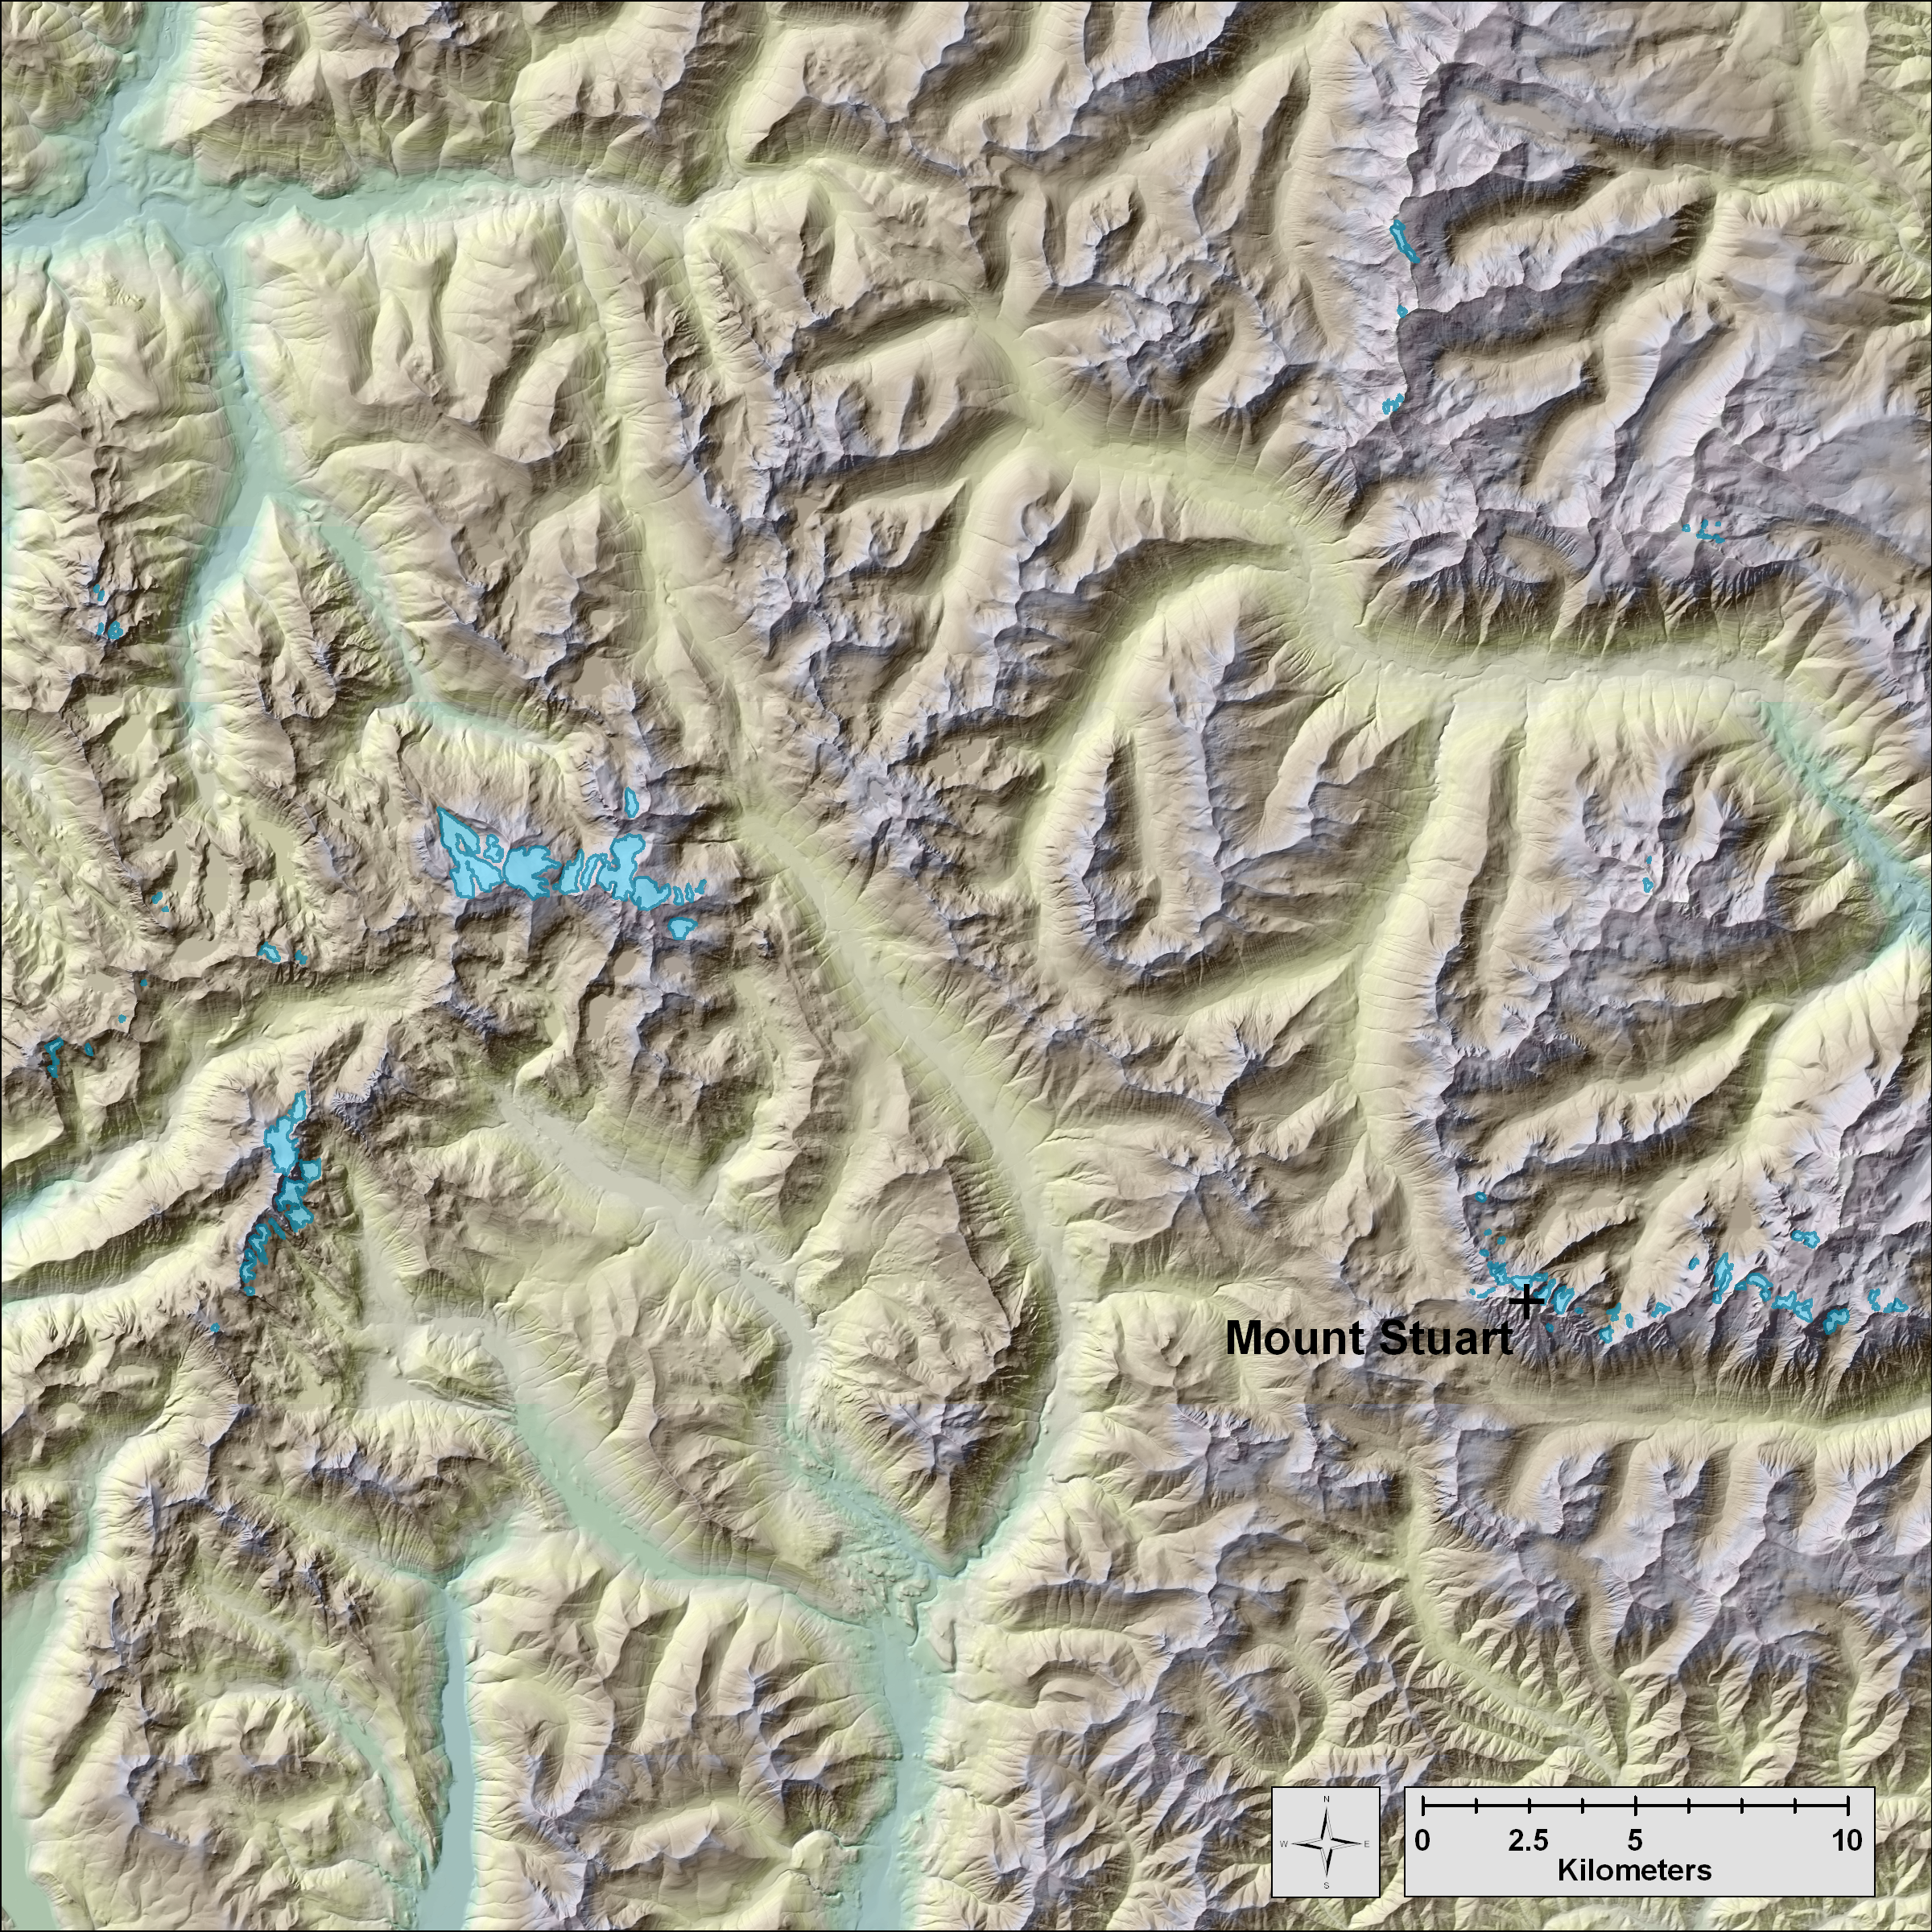 Shaded relief map of the Stuart Range. Click on the map above for the full size version. |
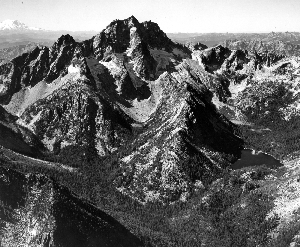 Mount Stuart. Sept 20, 1966. Photographer: Austin Post. (USGS Photographic Library) |
Back to Glaciers in Washington
Back to Contents
Olympic Mountains
|
The Olympic Mountains have 387 perennial snow/ice features, including about 20 named glaciers. The total area of ice features is 37 km2, and the area of named features is 22 km2. Blue Glacier, flowing from the summit of Mt Olympus, is a long-monitored glacier of the University of Washington. |
 Shaded relief map of the glaciers in Olympic National Park. Click on the map above for the full size version. |
 Blue Glacier. Oct 28, 1941. Photographer: W.B. Augustine |
Back to Glaciers in Washington
Back to Contents
Mount Rainier
|
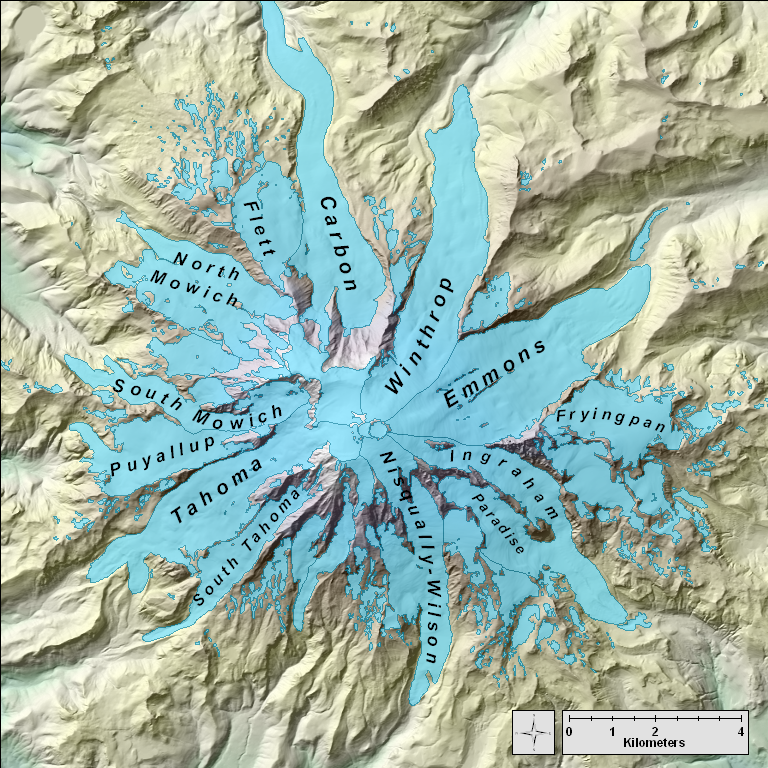
Mount Rainier has 495 perennial snow/ice features, including 33 named glaciers. The total ice-covered area is 94 km2, and the area of the named features is 88 km2. The elevation range of the glaciers is between 1,069m and 4,394m. |
Shaded relief map of Mount Rainier. Click on the map above for the full size version.
|
 North Mowich Glacier, September 1960. Photographer: Austin S. Post. (National Snow and Ice Data Center World Data Center for Glaciology, Boulder CO) |
|
 1928 map of Mount Rainier National Park. Click on the map above for full size version. |
|
Back to Glaciers in Washington
Back to Contents
Goat Rocks
|
Goat Rocks has 57 perennial snow/ice features with 4 named glaciers. The total ice-covered area is 5 km2, and the total area of the named glaciers is 3 km2. The elevation range of the glaciers is between 1,218m and 2,437m. |
 Shaded relief map of Goat Rocks. Click on the map above for the full size version. |
|
 Meade Glacier, August 2007 (John Scurlock)
|
||
Back to Glaciers in Washington
Back to Contents
Mount Adams
|
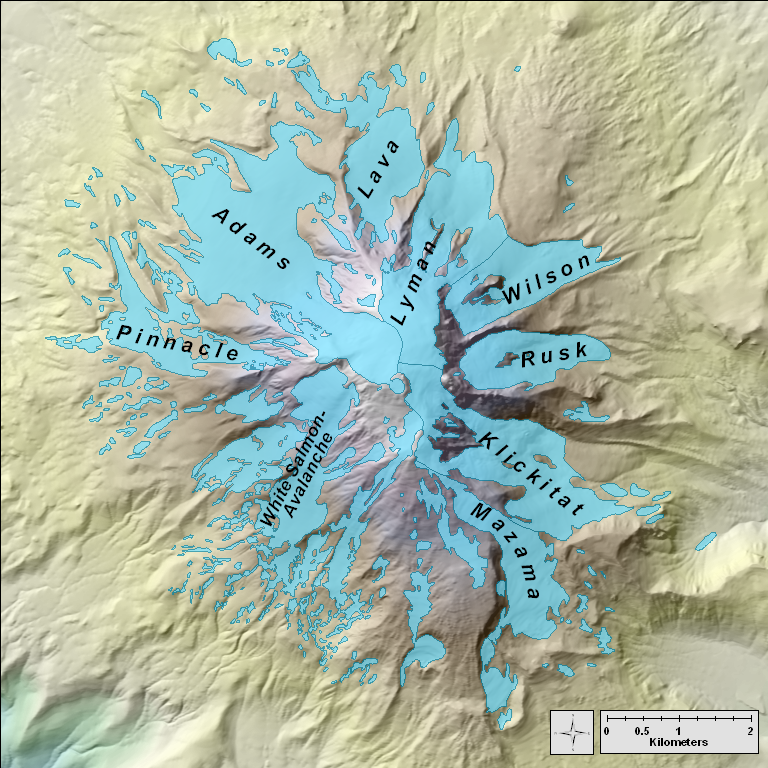
Mount Adams has 209 perennial snow/ice features and 11 named glaciers. The total ice-covered area is 24 km2. The area of named glaciers is 20 km2. The elevation range of the glaciers is between 1,752m and 3,746m. There has been little volcanic activity on Mount Adams in the past 10,000 years, however most of present-day Mount Adams formed rapidly in the previous 30,000 years. Since the formation, most of the upper part of the mountain has been eroded by glaciers. Additional areas are prone to debris avalanches because of weakened rocks from heated ground water and acidification by volcanic gases (Scott et al., 1995). |
Shaded relief map of Mount Adams. Click on the map above for the full size version.
|
|
 Lyman and Lava glaciers, October 2006. Photographer: Darryl Lloyd |
||
Back to Glaciers in Washington
Back to Contents
Mount Saint Helens
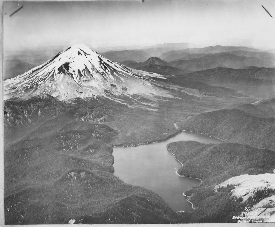 Mount St Helens, 1939 (Mazamas) |
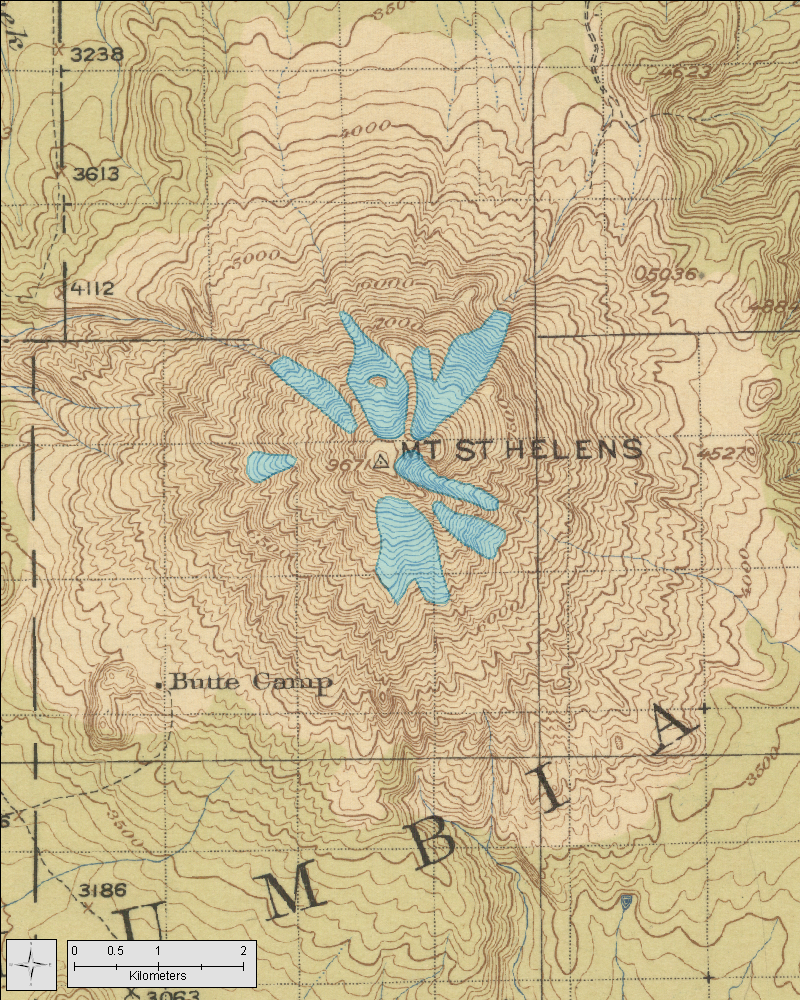
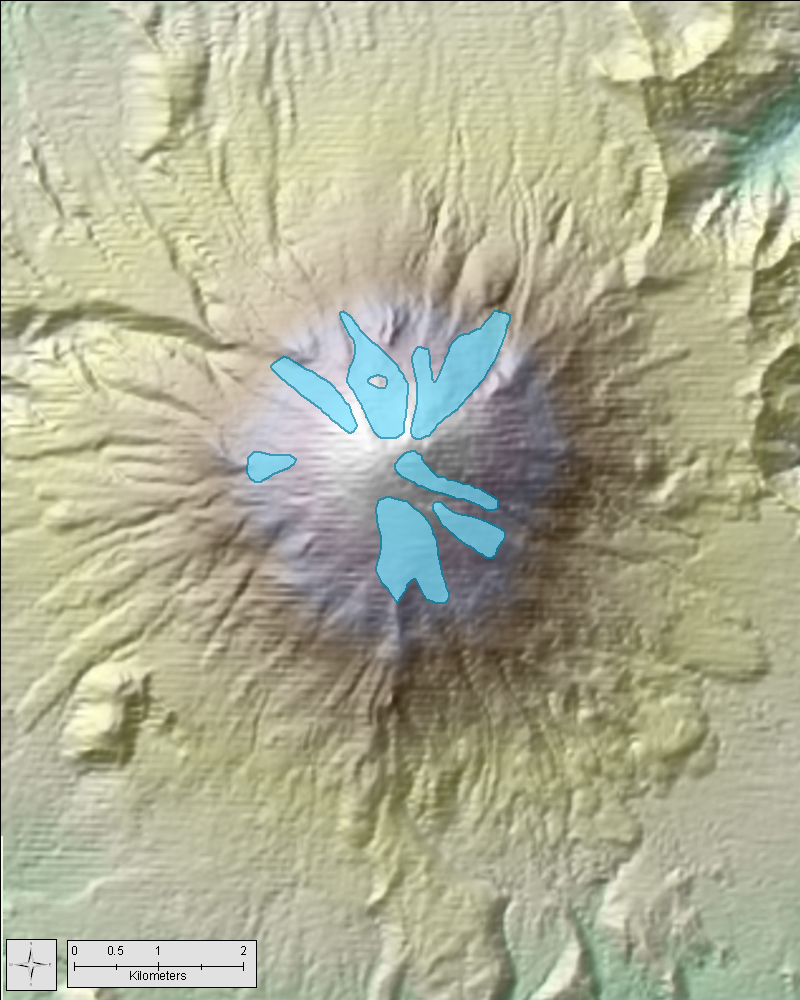
Mount Saint Helens is the most active volcano in the continental US. Over the past 300,000 years, there have been periods of violent explosions, as well as quieter lava flows (Clynne et al., 2005). Mount Saint Helens has 9 perennial snow/ice features and 7 named glaciers. The total ice-covered area is 2 km2. |
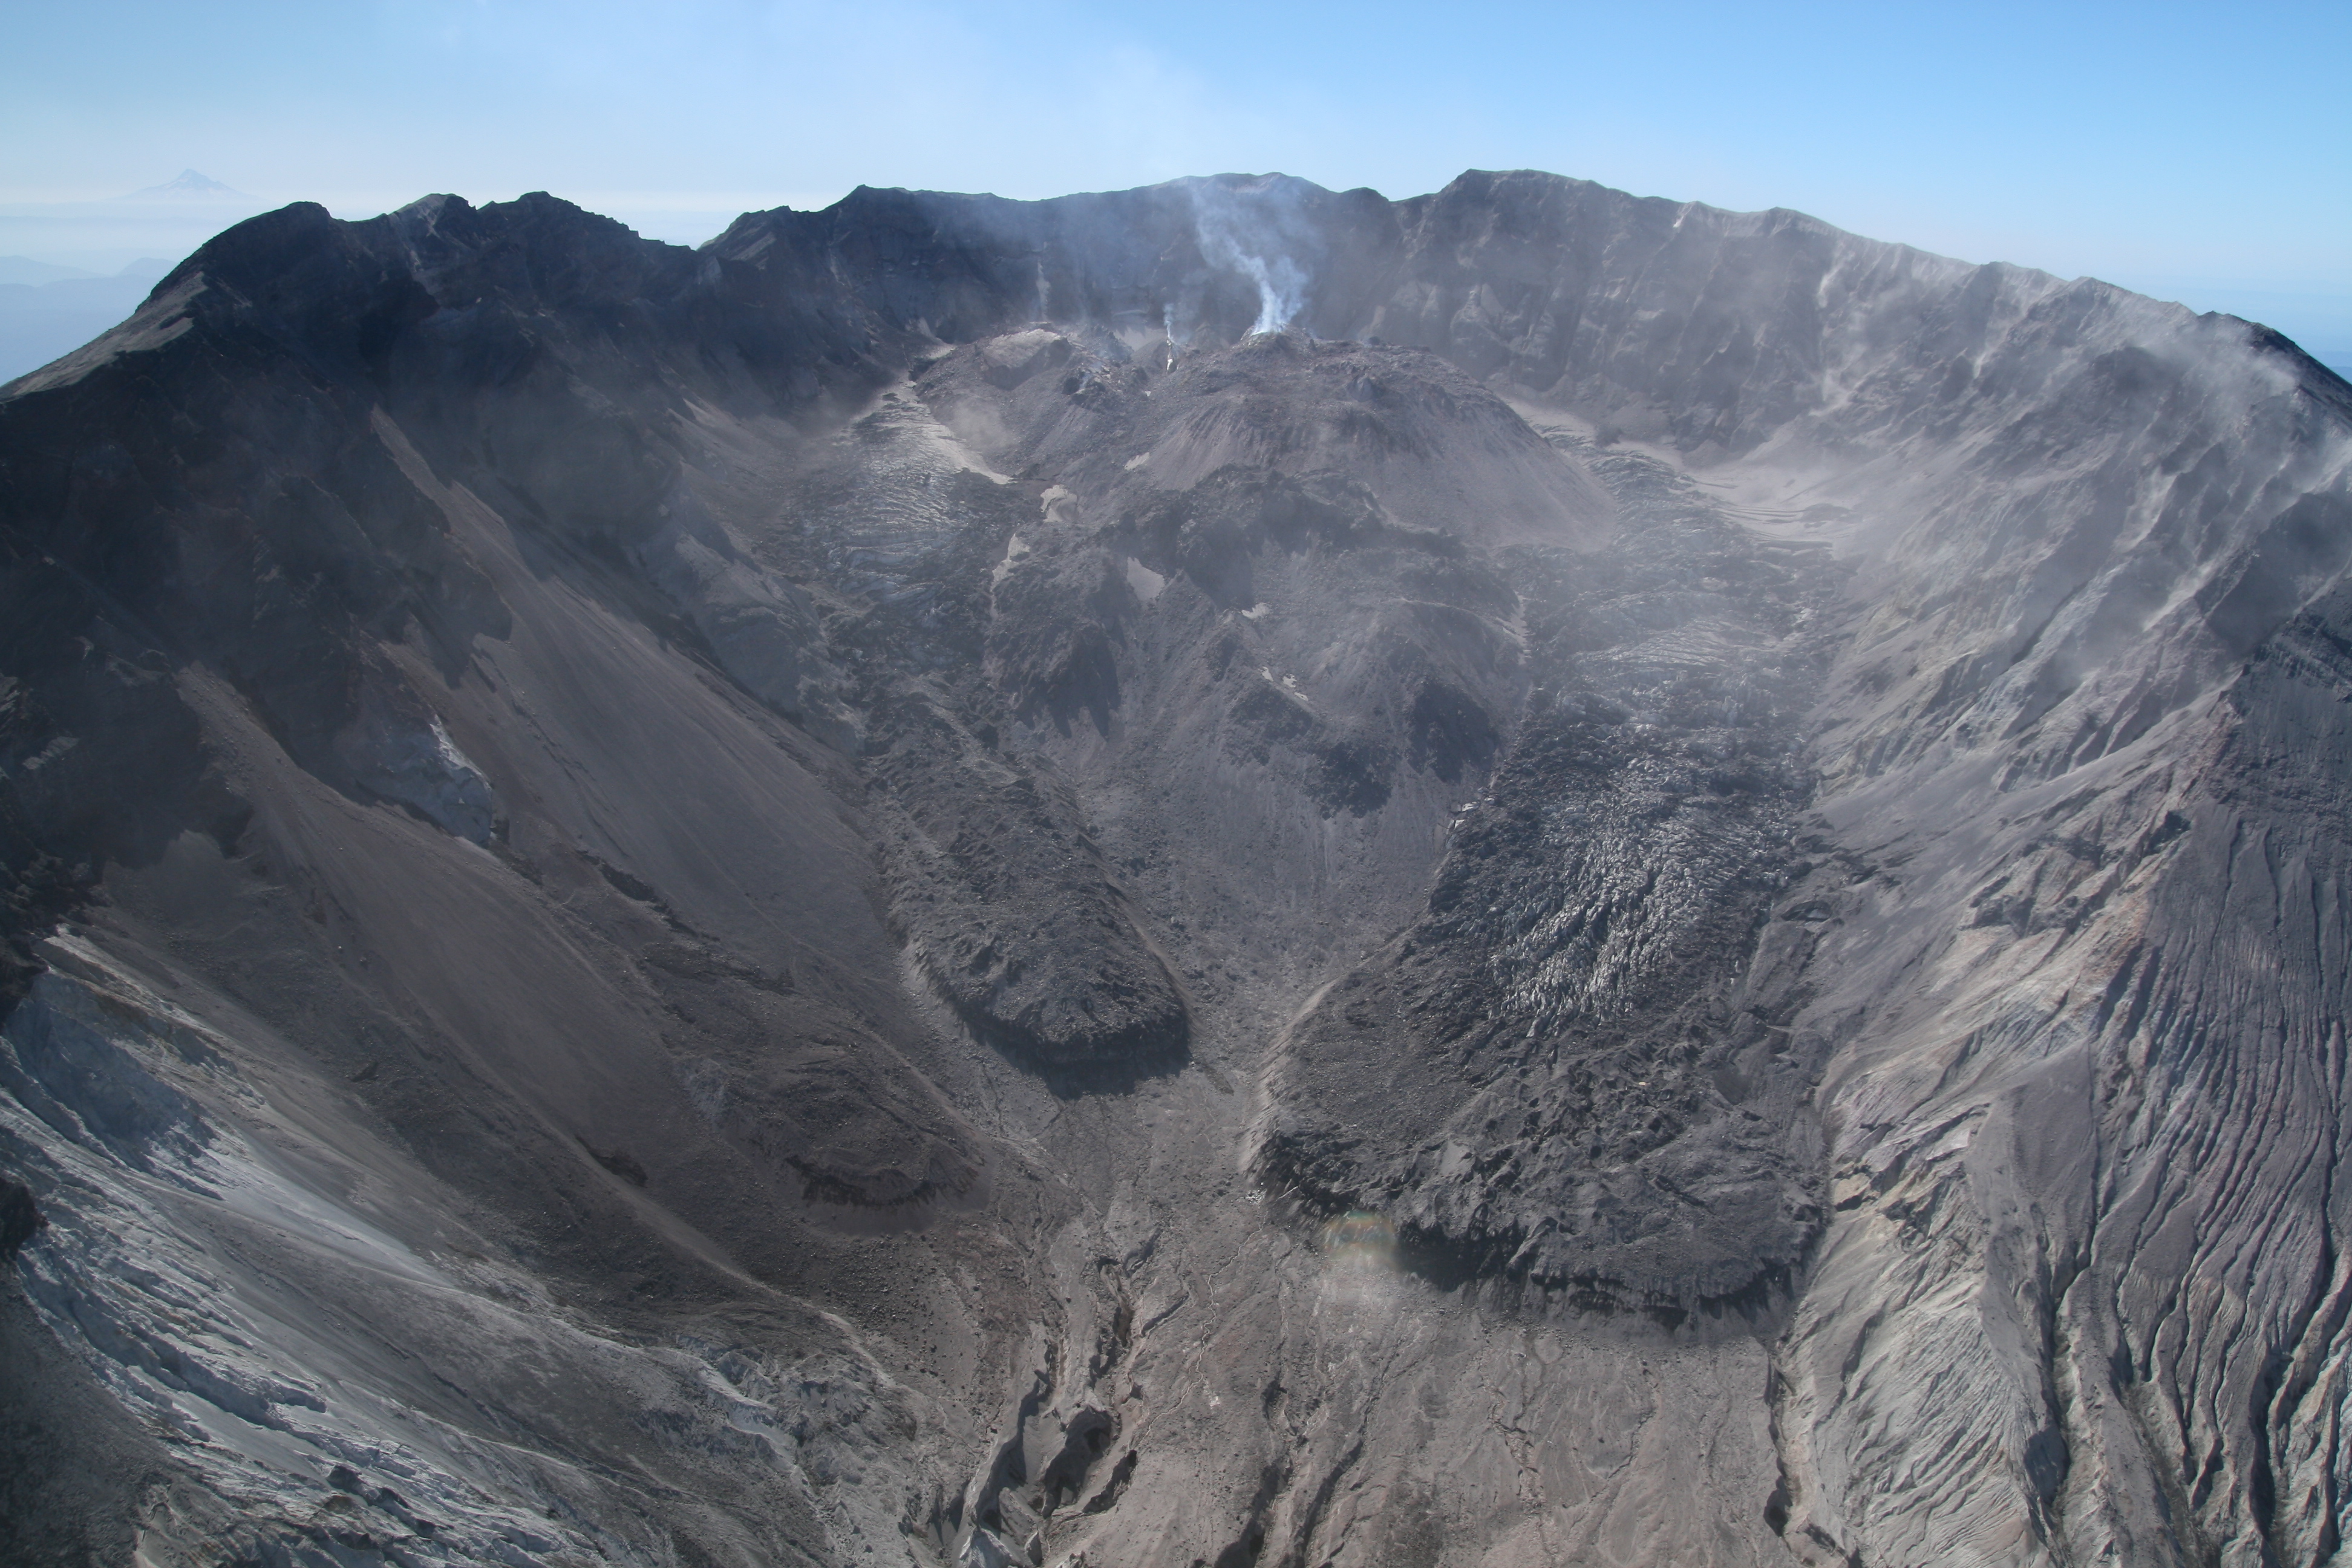
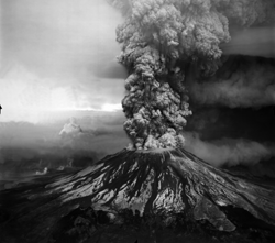 May 18, 1980. (Cascades Volcano Observatory) |
||||||||
|
||||||||||
|
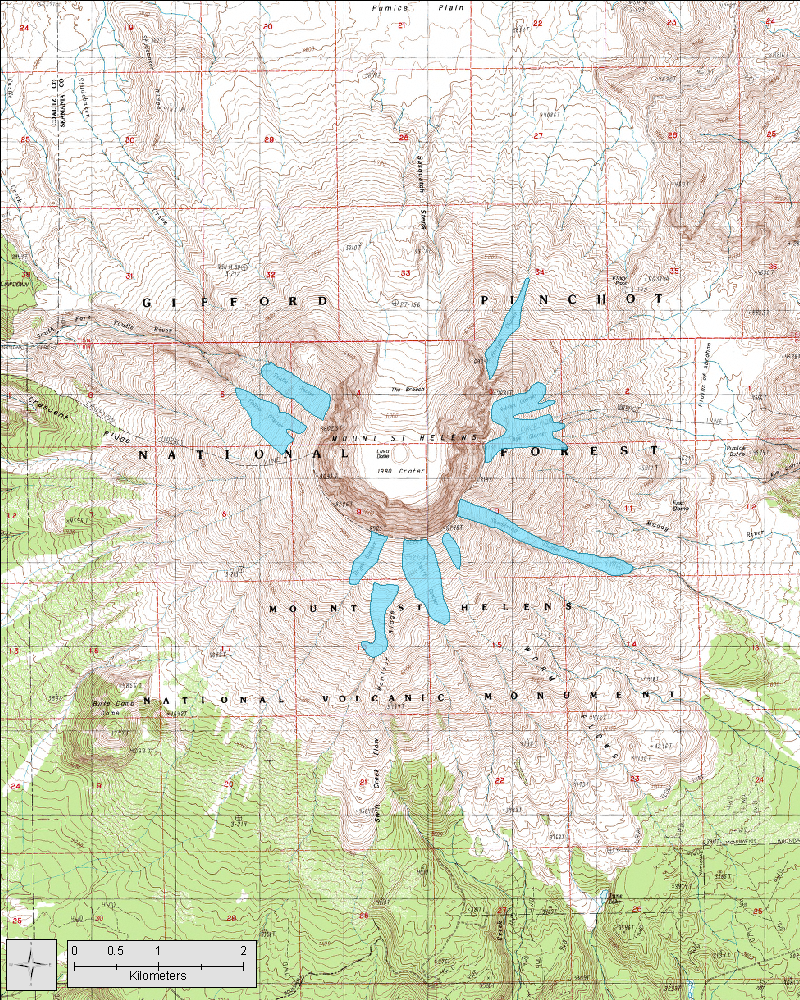
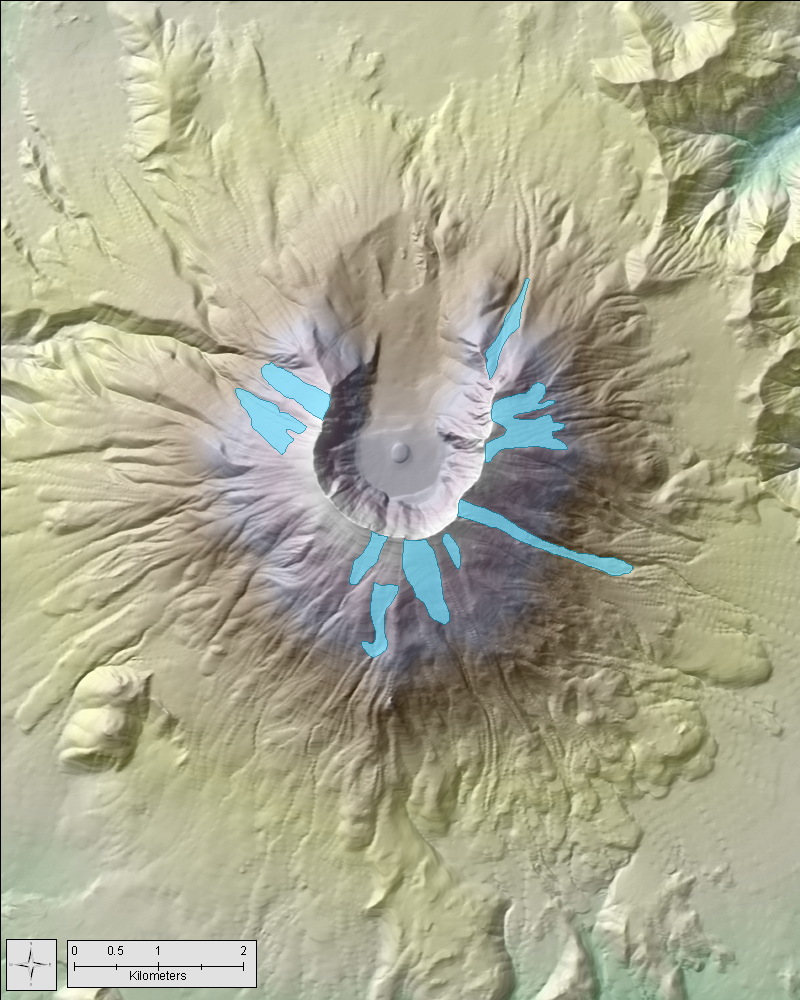
The eruption of Mount Saint Helens on May 18, 1980 removed the Loowit and Leschi glaciers, as well as reduced the area of the Wishbone, Shoestring, Ape, Nelson and Forsyth glaciers. The resulting crater is a large, 2 km wide, northward facing cirque with a steep headwall rising about 700 m above the crater floor (Schilling et al., 2004). The elevation of the highest point along the rim is about 2550 m. This headwall is the source of frequent rock and snow avalanches which have contributed greatly to the formation of the Crater Glacier since about 1986 (Schilling et al., 2004). The glacier formed gradually, and 1996 aerial photographs showed definite glacial features. As of 2001, Crater Glacier is now the largest on Mount Saint Helens at 1 km2. The Shoestring, Nelson, Forsyth and Dryer glaciers are no longer there, and only the Ape, Swift, Toutle, Talus, and two unnamed glaciers exist outside the crater with a combined volume of 0.52 km2 (Schilling et al., 2004). The deepest part of the crater-floor fill consists largely of rock avalanche debris which grades upward into deforming glacial ice (Walder et al., 2008; Price and Walder, 2007). As of 2002, the glacial ice was estimated to be about 150 m thick and with a volume of more than 76 million m3 (Pringle, 2002). At least 30% of the volume is estimated to be rock debris according to Mills and Keating (1992, via Pringle, 2002). Recent reports indicate that the uppermost part of the glacier probably contains at most 5% rock debris in discrete and discontinuous layers (Walder et al., 2008). In October 2004, Mount Saint Helens began building a dome in the 1980 crater. The erupting lava and consequent dome growth affected Crater Glacier. The eruption first pressed the east arm against the east wall, and then uplifted the glacier's west arm and effectively separated the glacier into two parts (Schilling et al., 2006). Mount Saint Helens has been more or less continuously active since the 1980 eruption. The most current period of eruptive activity was from 2004 until 2008 (USGS Cascades Volcano Observatory). |
||||||||||
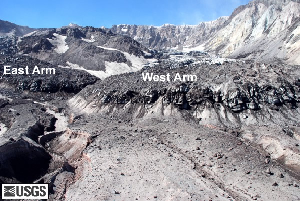 Both arms of Crater Glacier. July 31, 2008. Photo by Steve Shilling. (USGS Cascade Volcano Observatory) |
Prior to 2004, the Crater Glacier had two branches that extended from a main body and around the sides of the 270 m tall lava dome (Schilling et al., 2004). During the eruption that began in September 2004, a new plug of the lava dome pushed through the glacier bisecting it into eastern and western halves (Price and Walder, 2007). The dome then grew eastwards, squeezing the eastern glacier against the crater wall until April 2005 when expansion shifted to the west (Price and Walder, 2007). During the eastward squeeze, glacier thickness near doubled while surface speed increased (Price and Walder, 2007). Once dome growth shifted this surface motion stopped. Glacier melt associated with the eruption was minor, although ice volume was estimated to decrease to a volume of about 60 million km3. The lack of meltwater was to be expected since the ice is well insulated from the magma, which was also well below the temperature of the solidus (Walder et al., 2008). Using a two-dimensional flowband model of this event, Price and Walder (2007) found that the model that fit best required debris-laden ice that was 5 times stiffer and 1.2 times denser than normal, temperate ice (Price and Walder, 2007). The strain rates calculated were of a similar order to those measured in glacier surges, but with the forces instead oriented across flow (Price and Walder, 2007). These forces created a field of seracs as transverse crevasses cut across longitudinal crevasses formed during eastward dome growth (Walder et al., 2008). GPS-derived motion observations found that the Crater Glacier does not slide over its bed as does a normal alpine glacier (Walder et al., 2008). In this sense, the glacier effectively acts as a polar glacier and does not erode the subglacial surface through basal abrasion. The likely cause of this anomaly is that meltwater that reaches the glacier bed passes into the volcano’s groundwater system and does not flow along the bed through a typical drainage network to the terminus (Walder et al., 2008). |
|||||||||
|
Crater Glacier, September 2007. Photo by John Scurlock. |
|
|||||||||
|
For more information about the video, click here |
||||||||||
Back to Glaciers in Washington
Back to Contents
Glacier Change
South Cascade Glacier
1928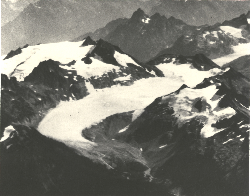 |
1955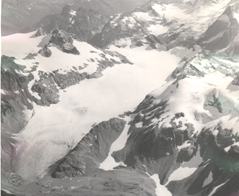 |
1966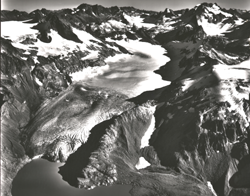 |
1986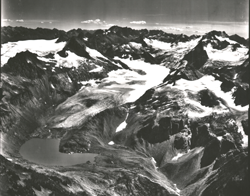 |
2000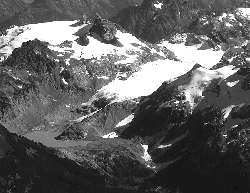 |
2006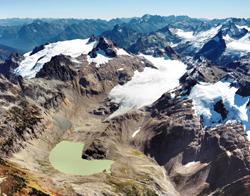 |
|
South Cascade Glacier has the second longest mass balance record in the world. The glacier is the focus of glacier research in the area since the USGS monitoring program began in 1957. To look at the history of USGS measurements on South Cascade, click HERE. |
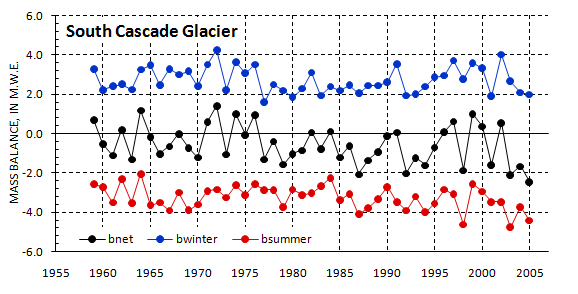 Mass balance record of South Cascade Glacier since 1957. (Bidlake et.al, 2005) |
Mount Baker
|
|||
|
|||
Olympic Range
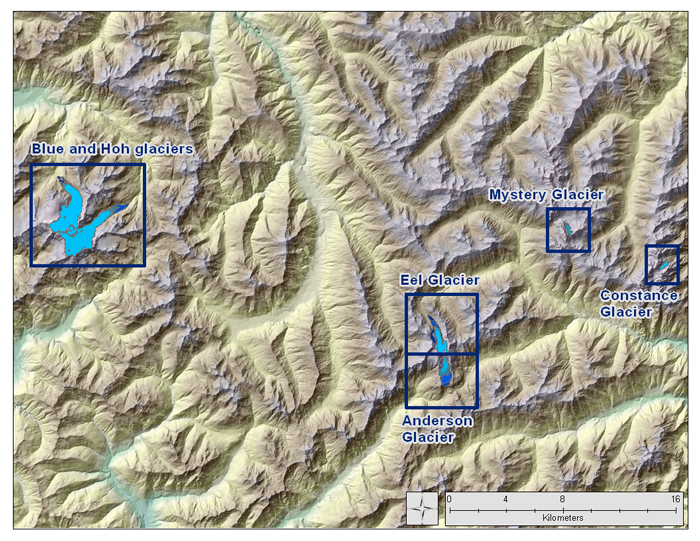 Click inside the blue boxes for a detailed view of glacial termini.
|
|
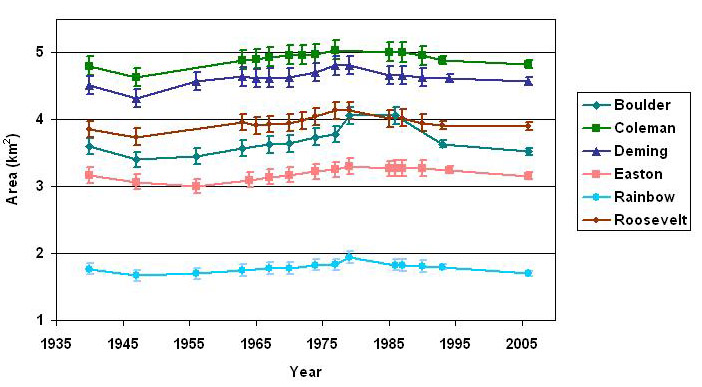
 Chart displaying changes in glacier area over the past century. (Hoffman and Fountain, unpublished) |
|
 Anderson Glacier in 1936. Photographer: Asahel Curtis. (Historic Photo Collection, courtesy of the Washington State Historical Society, Tacoma, Washington) |
 Anderson Glacier in 2004. Note a lake occupies the foreground which was occupied by ice in 1936. Photographer: Matt Hoffman |
Mount Rainier
|
Mount Rainier’s glaciers have retreated considerably since August Kautz first noted the position of the Nisqually Glacier in 1857 (Kautz 1875). His visit was just after the peak of the Little Ice Age, a period of general glacial advance. The Nisqually Glacier reached its furthest Little Ice Age extent in 1840, 2.3 km from its 2006 location (Heliker, Johnson, and Hodge 1984). The easily-accessible Nisqually Glacier flows near the Paradise Visitor Center and has therefore been closely monitored over the 20th century. Several minor advances have been documented in the 1950’s and mid-1970’s, but the overall change is one of dramatic retreat: 1.3 km from 1931 to 2006 based on recorded extents and aerial photographs (Hekkers 2008; Nylen 2004). |
||
|
Geographic setting and aspect have inconsistent effects on glaciers. The Nisqually Glacier, like other south-facing glaciers, has retreated more than north-facing glaciers, resulting in an area loss of 0.44 km2 in the last 70 years of the 20th century (Nylen 2004). South-facing glaciers lost 26% of their area while northern glaciers lost only 17%, and smaller glaciers are generally more susceptible to climatic changes than are larger glaciers (Nylen 2004). Rock avalanches can insulate a glacier, e.g., the 1963 rock avalanche on the Emmons Glacier that sustained a glacial advance through the early 1980's (Driedger 1986). |
 Nisqually Glacier in 1930.
|
 Nisqually Glacier in 2007. Photographer: M. Hekkers. |
| Note that terminous cannot be seen in 1930 photo, while the 2007 terminous is in sight. | ||
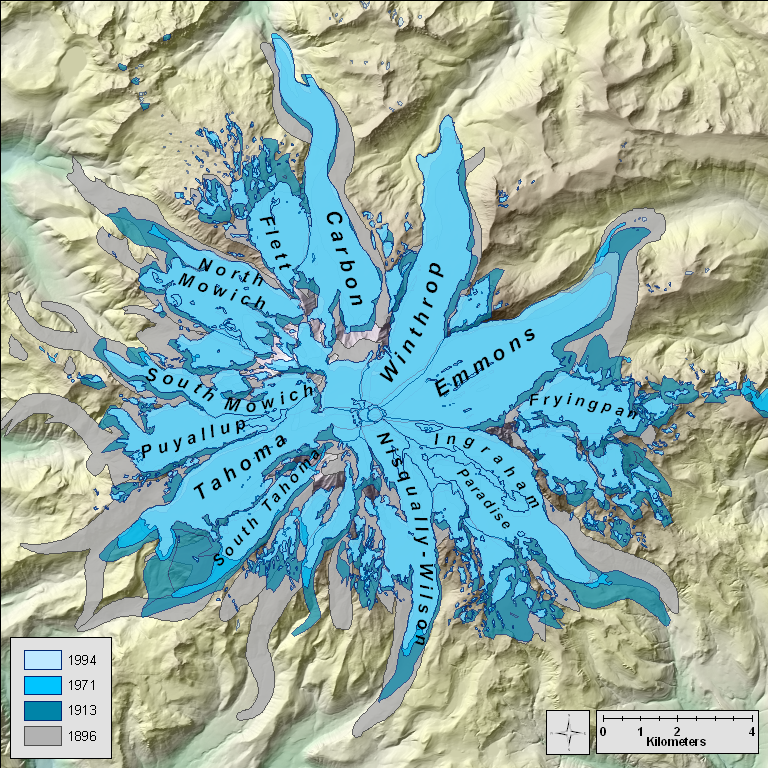 Map showing glacier change since 1896. Click on the map above for the full size version. |
||
Comparison Photos
|
Blue Glacier in 1899 (left, from USGS) and in 2010 (right, photo by Janis Burger, ONP) |
|
Boston Glacier in 1957 (left, from USGS) and in 2005 (right, photo by John Scurlock) |


Fun Facts
|
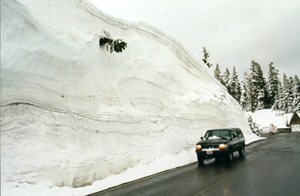 Snowdrifts during the winter of '98-'99 (www.welove2ski.com) |
|
|
||
 Washington apples (Scott Bauer, USDA Agriculture Research Image Gallery) |
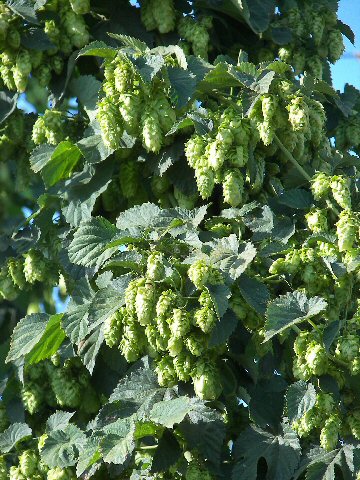 Hopfield (www.globalmoisture.com) |
 Raspberries (chefmom.sheknows.com) |
Links
Bibliography
|
Baker, M., 1900, Survey of the northwestern boundary of the United States, 1857-1861, Washington, Government Printing Office, US Geological Survey Bulletin, 78 p. Beckey, F., 2003, Range of Glaciers, the Exploration and Survey of the Northern Cascade Range. Oregon Historical Society Press, Portland, OR. 568 p. Bidlake, W. R., Josberger, E. G., and Savoca, M. E., 2007, Water, Ice, and Meteorological Measurements at South Cascade Glacier, Washington, Balance Years 2004 and 2005: U.S. Geological Survey Scientific Investigations Report 2007-5055. 70 p. Clynne, M. A., Ramsey, D. W., and Wolfe, E. W., 2005, Pre-1980 eruptive history of Mount St. Helens, Washington: U.S. Geological Survey Fact Sheet 2005-3045. 4 p. Conway, H., Rasmussen, L. A., and Marshall, H. P., 1999, Annual Mass Balance of Blue Glacier, USA: 1955-97: Geografiska Annaler Series A: Physical Geography, v. 81, no. 4, p. 509-520. Denton, G. H., and Hughes, T. J., 1981, The Last Great Ice Sheets. John Wiley & Sons, New York, NY. 484 p. Driedger, C. L., 1986, A Visitor's Guide to Mount Rainier Glaciers. Northwest Interpretive Association, Seattle, WA. 80 p. Emmons, S. F., 1877, The Volcanoes of the Pacific Coast of the United States: Journal of the American Geographical Society of New York, v. 9, p. 45-65. Fountain, A. G., Hoffman, M., Jackson, K., Basagic, H. J., Nylen, T. H., and Percy, D., 2007, Digital outlines and topography of the glaciers of the American West: U.S. Geological Survey Open-File Report 2006-1340. 23 p. Fountain, A. G., Jackson, K., Basagic, H. J., and Sitts, D., 2007, A century of glacier change on Mount Baker, Washington, in Proceedings Geological Society of America - Abstracts with Programs, Volume 39, p. 67. Fountain, A. G., and Jacobel, R. W., 1997, Advances in ice radar studies of a temperate alpine glacier, South Cascade Glacier, Washington, U.S.A: Annals of Glaciology, v. 24, p. 303. Granshaw, F. D., 2002, Glacier Change in the North Cascade National Park Complex, Washington USA, 1958 to 1998. M.S. Geology, Portland State University. Granshaw, F. D., and Fountain, A. G., 2006, Glacier change (1958-1998) in the North Cascades National Park Complex, Washington, USA: Journal of Glaciology, v. 52, no. 177, p. 251-256. Hague, A., 1913, Biographical Memoir of Samuel Franklin Emmons, 1841-1911. National Academy of Sciences, Washington, DC. Biographical Memoirs, v. 13. Harper, J. T., 1993, Glacier Terminus Fluctuations on Mount Baker, Washington, USA, 1940-1990, and Climatic Variations: Arctic and Alpine Research, v. 25, no. 4, p. 332-340. Hekkers, M. L., 2008, Climatic and Spatial Variations of Mount Rainier's Glaciers for the Last 12,000 Years, Washington, U.S.A. M.S. Geology, Portland State University. Heliker, C. C., Johnson, A., and Hodge, S. M., 1984, The Nisqually Glacier, Mount Rainier, Washington, 1857-1979: a summary of the long-term observations and a comprehensive bibliography: USGS Open-File Report 83-541. 20 p. Kautz, A. V., 1875, Ascent of Mount Rainier: The Overland Monthly, v. 14, p. 393-403. Nylen, T. H., 2004, Spatial and temporal variations of glaciers (1913-1994) on Mt. Rainier and the relation with climate. M.S. Geology, Portland State University. Price, S. F., and Walder, J. S., 2007, Modeling the Dynamic Response of a Crater Glacier to Lava-Dome Emplacement: Mount St. Helens, Washington, USA: Glaciology, v. 45, p. 21-28. Pringle, P. T., 2002, Roadside Geology of Mount St. Helens National Volcanic Monument and Vicinity, Olympia, WA, Washington Department of Natural Resources, 124 p. Russell, I. C., 1892, Climatic changes indicated by the glaciers of North America: American Geologist, v. 9, no. 5, p. 322-336. -, 1898, Glaciers of Mount Rainier: USGS 18th Annual Report, v. 2, p. 349-415. Schilling, S. P., Carrara, P. E., Thompson, R. A., and Iwatsubo, E. Y., 2004, Posteruption glacier development within the crater of Mount St. Helens, Washington, USA: Quaternary Research, v. 61, no. 3, p. 325. Schilling, S. P., Ramsey, D. W., Messerich, J. A., and Thompson, R. A., 2006, Rebuilding Mount St. Helens: U.S. Geological Survey Scientific Investigations Map 2928. Scott, W. E., Iverson, R. M., Vallance, J. W., and Hildreth, W., 1995, Volcano Hazards in the Mount Adams Region, Washington: U.S. Geological Survey Open-File Report 95-492. 11 p. Tabor, R. W., 1982, Geologic map of the Wenatchee 1:100,000 quadrangle, central Washington: U.S. Geological Survey Map. Waitt, R. B. J., and Thorson, R. M., 1983, The Cordilleran Ice Sheet in Washington, Idaho, and Montana, in Wright, H. E., and Porter, S. C., eds., Late-Quaternary environments of the United States, Volume 1: Minneapolis, University of Minnesota Press, p. 53-70. Walder, J. S., Schilling, S. P., Vallance, J. W., and LaHusen, R. G., 2008, Effects of Lava-Dome Growth on the Crater Glacier of Mount St. Helens, Washington: USGS Professional Paper, v. 1750, p. 258-276. |
Created by Mike Hekkers and Kristina Thorneycroft
Last modified 7 Sep 2011